
Use kmap to visualize anonymity/uniqueness in your data
While I was working on a paper recently, I was asking myself the question how to visualize the uniqueness (or anonymity set sizes) in the data. The only visualization that I am still aware of is Fig. 3 in the Panopticlick experiment, which shows anonymity set sizes created by each value of each attribute. This is it:
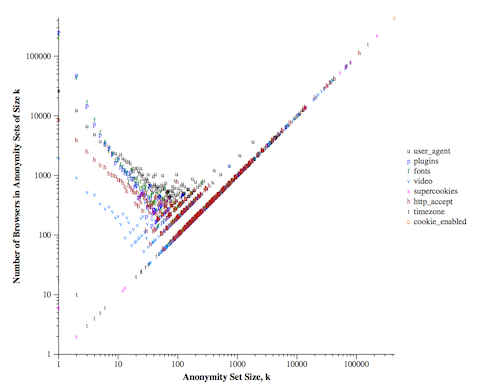
While this is a nice figure, it is quite hard to understand it quantitatively, and it can be even more complicated if you want to compare different datasets by using this visualization method. However, it would be nice to understand the state of uniqueness in datasets, especially if you consider different attributes in each case, apply anonymization or other countermeasures to decrease uniqueness.
This is why I started looking for another option, which finally lead to creating a simple, but heavily customizable plotting function I call kmap [code]. This tool can be used for multiple purposes, either if you are a data scientist experimenting or looking for a way that enables explanatory visualization to non-experts. It is useful to
- visualize how different attributes partitionate your data into anonymity sets,
- how different anonymization schemes or their setup affect uniqueness,
- show how precise a certain fingerprinting method is.
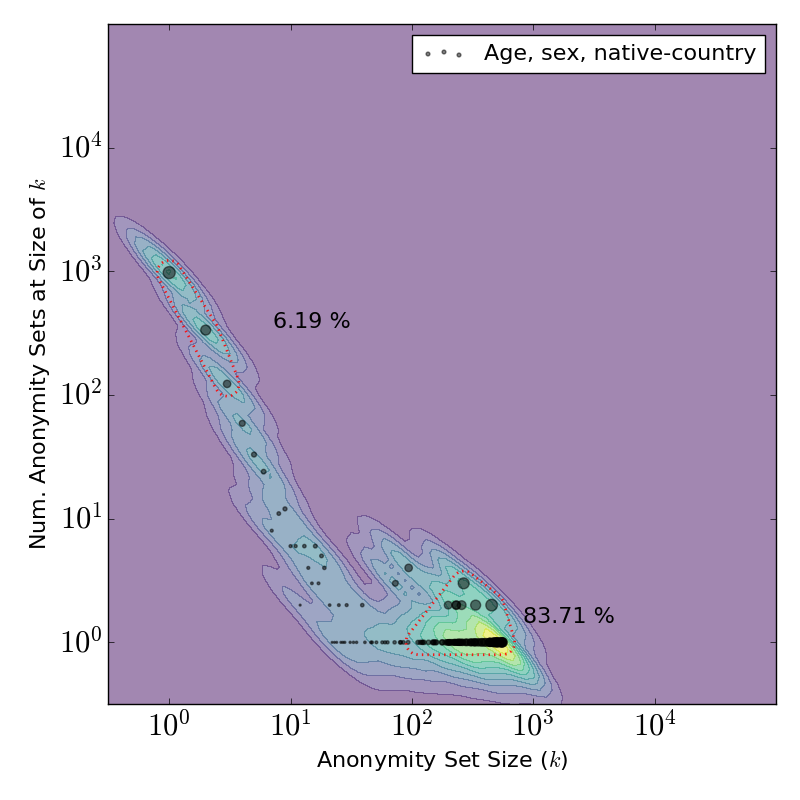
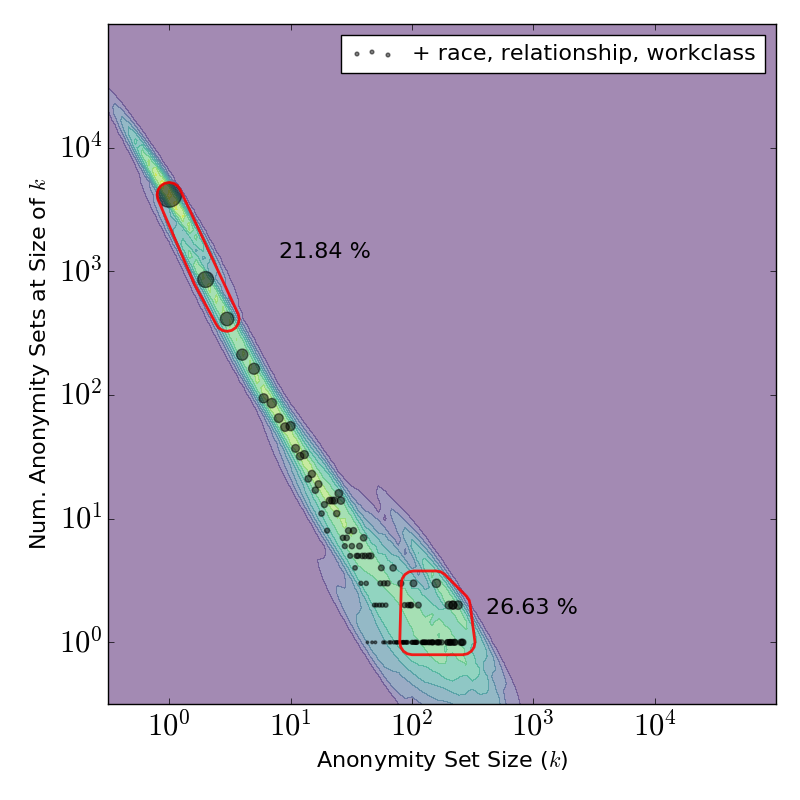
Let's see a nice example based on UCI Adult Data Set. This tabular dataset contains attributes like age, sex or workclass of more than 30k adults. Let's pretend that we are considering releasing this dataset, and we would like to know how many (and which) attributes could be safely released. In order to get a better understanding of this, let's visualize the level of identification (uniqueness) if we release only 3, 6 or 9 attributes of each user. This looks like this with kmap:
| 3 attributes | 6 attributes | 9 attributes |
 |
 |
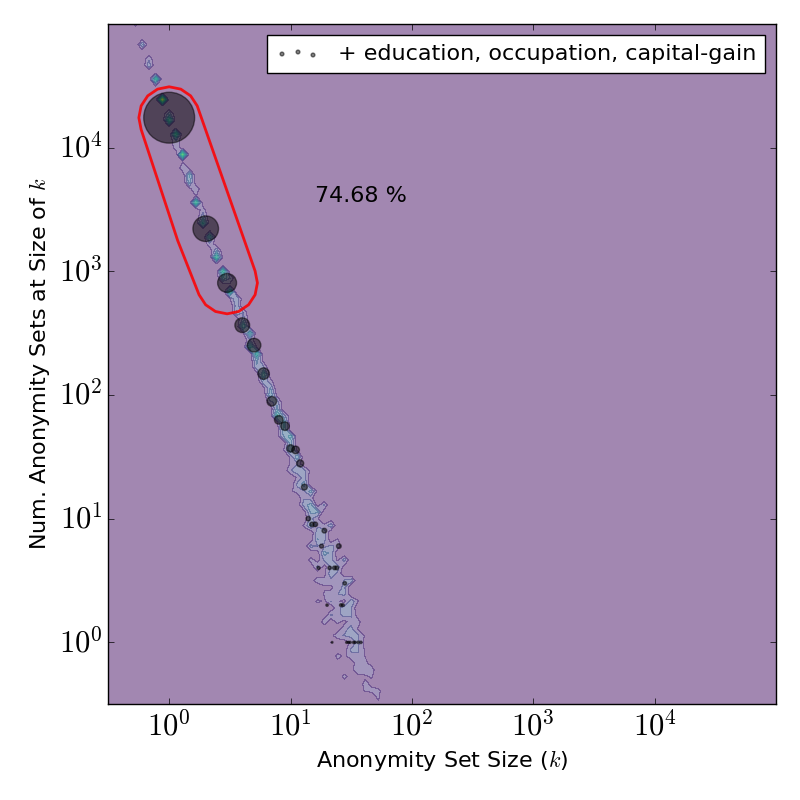 |
It is quite easy to tell the differences by looking at the figures: releasing only 3 or 6 attributes is relatively safe (*) as less than 25% of the dataset can be uniquely identified. On the other hand, if 9 attributes are released, that would make almost 75% of users concerned by the release unique.
If you would like to try out kmap for your self, you can find the code and the files for the example in this git repository. Plus, our paper got accepted where this visualization was used, thus more useful examples can be expected.
I would like to hereby thank Gergely Acs, Claude Castelluccia, Amrit Kumar and Luca Melis for their comments while I was developing kmap.
(*) What is safe or not is another question; in some scenarios even having 6% of the users identifiable can be considered as a problem.
Comments
0 comments.
No comments.
Post new comment
Anyone can comment, in case of unregistered senders all fields are optional. Comment can be anonymous.